

Entrust your NGS Projects to Our Experts, Contact Us Today at ngs@apicalscientific.com!
BI Demo Reports
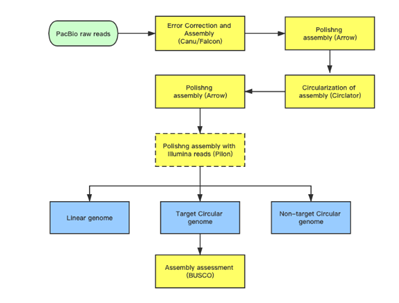
Bacterial Whole Genome Sequencing (De novo)
Analysis pipeline
The hierarchical genome assembly method is utilised during assembly with PacBio data (HGAP). The long reads are pre-assembled or error-corrected in the first round. This entails choosing the dataset’s longest reads as the seed reads (user-defined length cutoff). To accurately produce consensus sequences, all shorter reads are aligned to the seed reads. These are also known as “error corrected” reads and are pre-assembled reads in our terminology. Accuracy for preassembled reads typically exceeds 99%. The prereads are aligned with one another and put together into genomic contigs in the subsequent stage of assembly.
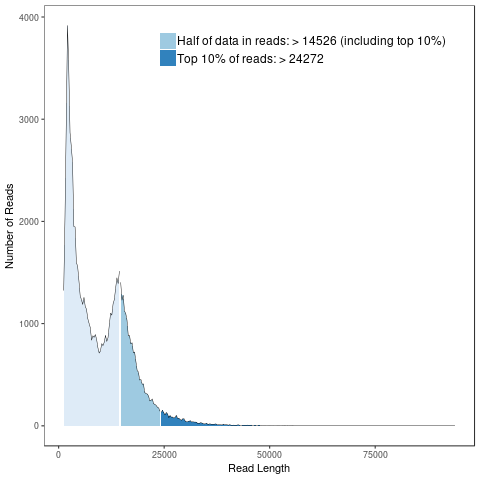
Subreads Statistics
Each polymerase read is divided into one or more subreads that each contain only the sequence from a single polymerase pass on a single strand of an insert inside an SMRTbell template. The subreads include all of the quality values and kinetic measurements. Subreads are useful in applications such as de novo assembly, resequencing, base modification analysis, and so on.
Gene component and gene function analysis
Generally, bacterial genome annotation is the starting point for analysis of genome content. This generally involves the application of diverse methods to identify features on a genome assembly such as protein-coding and non-coding genes, repeats and transposable elements. Additionally, the annotation were also analysed for functional annotation analysis which include GO, KEGG, KOG, NR and Pfam
GO annotation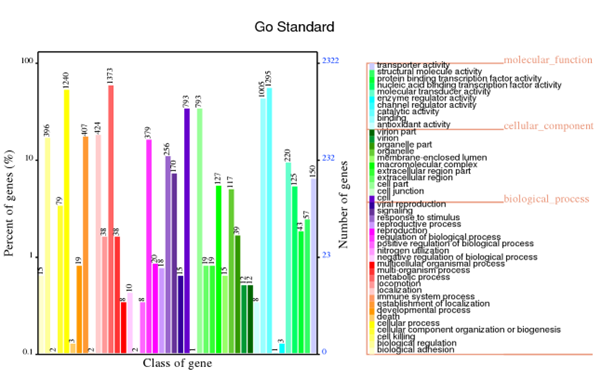
KEGG Annotation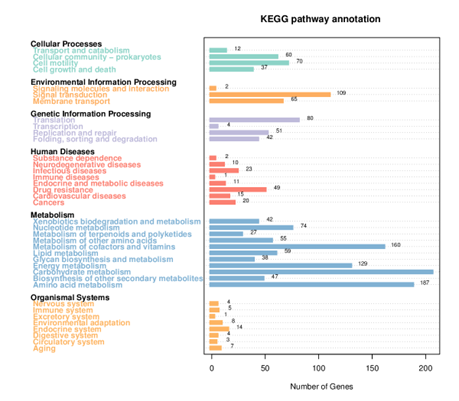
RNA sequencing
Analysis workflow
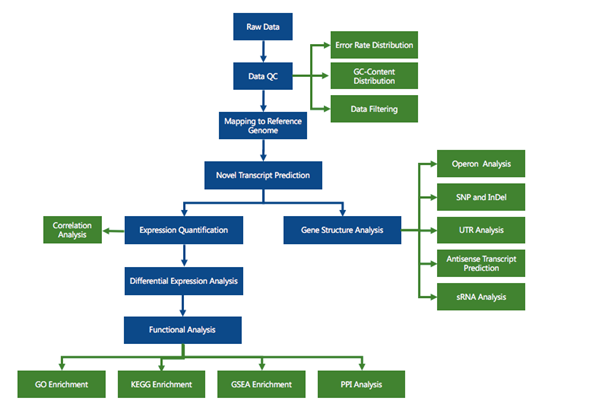
RNA sequencing (RNA-seq) has led to advances of cellular function by giving scientists a previously unattainable understanding of the transcriptional landscape of cells. Using the high-throughput and precise next-generation sequencing method (NGS), RNA-seq exposes gene expression profiles and depicts the ongoing changes in the transcriptome. Bioinformatic analyses are carried out and results are delivered that are ready for publishing. The bioinformatic pipeline’s step-by-step procedure is described in the flowchart below.
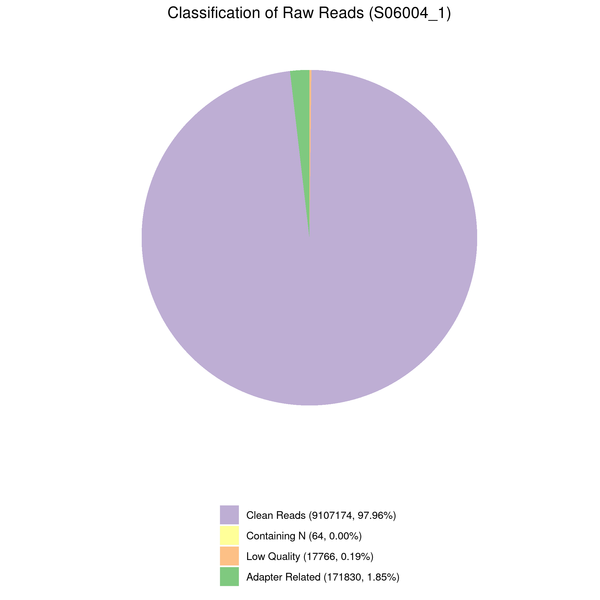
Data filtering
The downstream analysis’s quality will be impacted by the sequenced reads’/raw reads’ frequent presence of adaptor- or low-quality-read-containing reads. Raw reads were processed to produce clean reads to prevent this. The process includes
(1) Eliminate adaptor-contaminated reads.
(2) Remove reads when read contains more than 10% unknown nucleotides (N > 10%).
(3) Eliminate reads when more than 50% of them are composed of low-quality nucleotides (Base Quality less than 5).
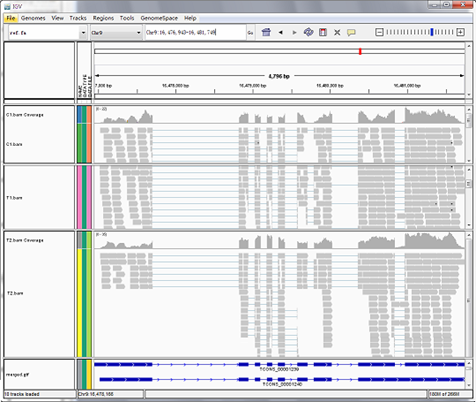
Reads mapping to reference genome
Files are provided in BAM format, a standard file format that contains mapping results, and the corresponding reference genome and gene annotation file for some species. The Integrative Genomics Viewer (IGV) is recommended for visualizing data from BAM files. The IGV has several features: (1) it displays the positions of single or multiple reads in the reference genome, as well as read distribution between annotated exons, introns or intergenic regions, both in adjustable scale; (2) displays the read abundance of different regions to demonstrate their expression levels, in adjustable scale; (3) provides annotation information for both genes and splicing isoforms; (4) provides other related annotation information; (5) displays annotations downloaded from remote servers and/or imported from local machines.
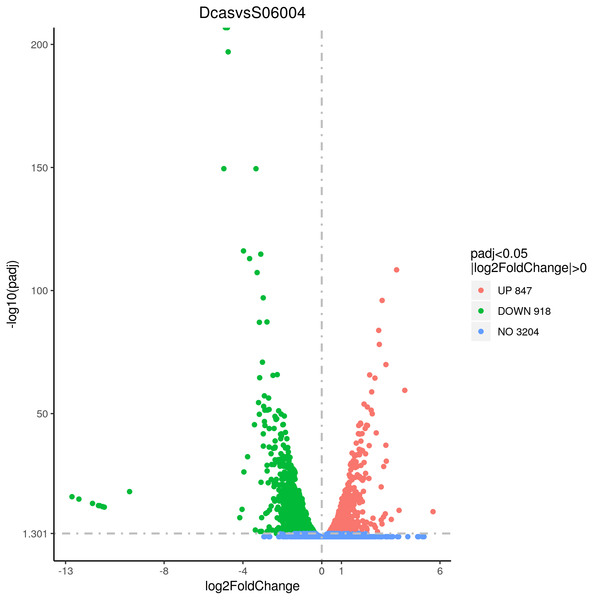
Volcano plot
Volcano plots are used to infer the overall distribution of differentially expressed genes. For the samples with biological replicates, the threshold of differential expression genes is: padj < 0.05. For the samples without biological replicates, the threshold of differential expression genes is: |log2(FoldChange)| > 1 and qvalue < 0.005
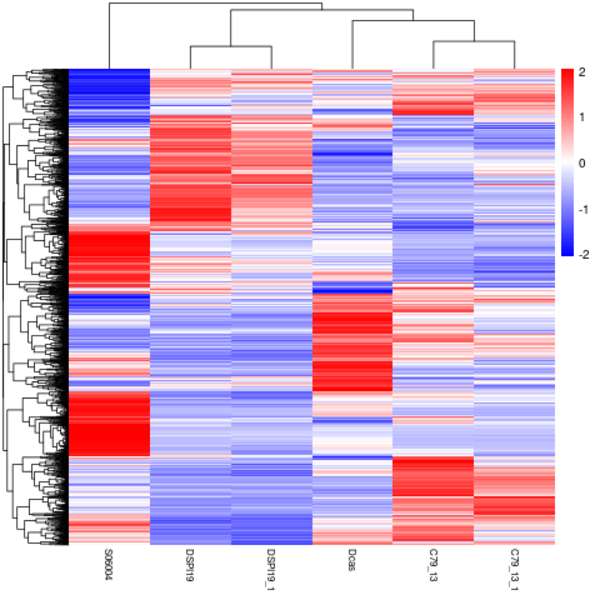
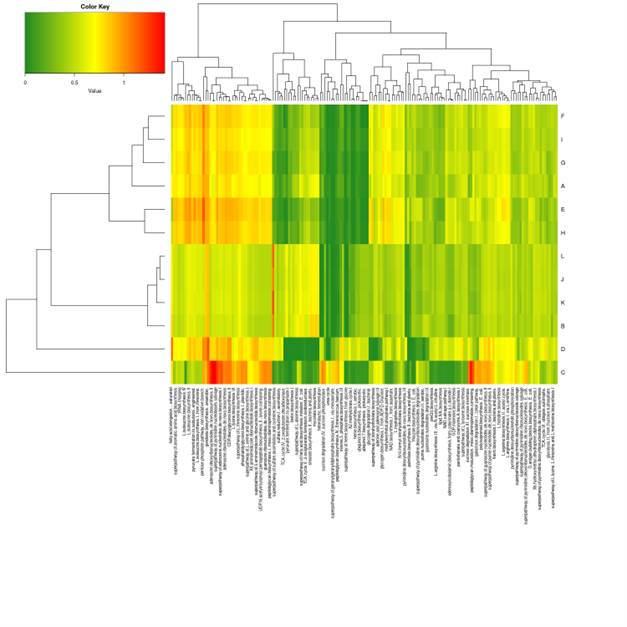
Cluster analysis of gene expression differences
Clustering is extremely useful for hypothesis generation and data exploration in general. It may be able to detect unknown functions of previously defined genes or the function of unknown genes by clustering genes with similar expression patterns. the log10(FPKM+1) value was used to cluster the overall results of the FPKM cluster analysis. Genes with high expression levels are indicated by red, while genes with low expression levels are indicated by blue.
Enrichment analysis
Discovering which biological processes or pathways have a substantial relationship with differentially expressed genes is feasible through enrichment analysis of the differentially expressed genes. GO Enrichment and KEGG Enrichment are two enrichment analyses that are included.
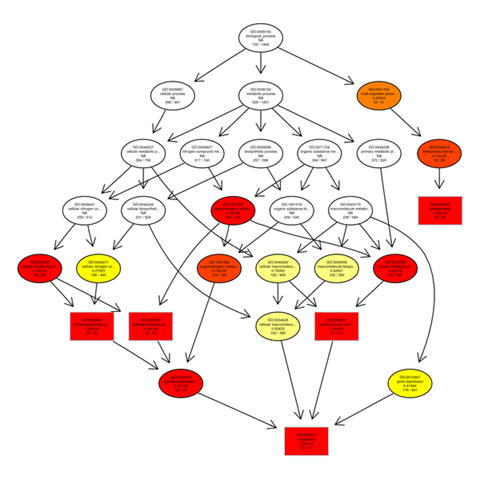
Gene ontology gene enrichment analysis
The outputs of the GO enrichment of DEGs are displayed using a Directed Acyclic Graph (DAG). The range of functions gets narrower from top to bottom on the branches, which stand in for confinement relationships. In a directed acyclic graph, the top ten GO enrichment results are typically chosen as the master nodes. These nodes display the associated GO words together via the containment relationship, and the degree of colours indicates the extent of enrichment. Separate DAG graphics are presented for biological process, molecular function, and cellular component.
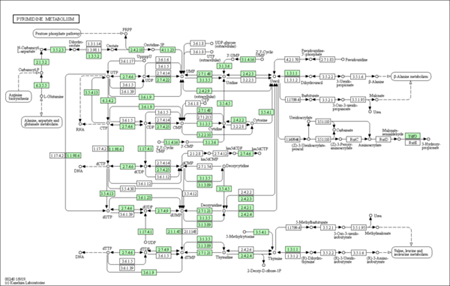
KEGG enrichment pathways
The KEGG enrichment pathway reveals that DEGs are strongly enriched pathways. This technique provides mechanistic insight into gene lists derived from genome-scale (omics) research and reveals biological pathways that are enriched in a gene list more than would be predicted by chance. The diagram is labelled in red for nodes that only include up-regulated genes, green for nodes that only contain down-regulated genes, and yellow for nodes that contain both up- and down-regulated genes.
Amplicon Sequencing
(Metagenomics: 16s/18s and Fungus ITS)
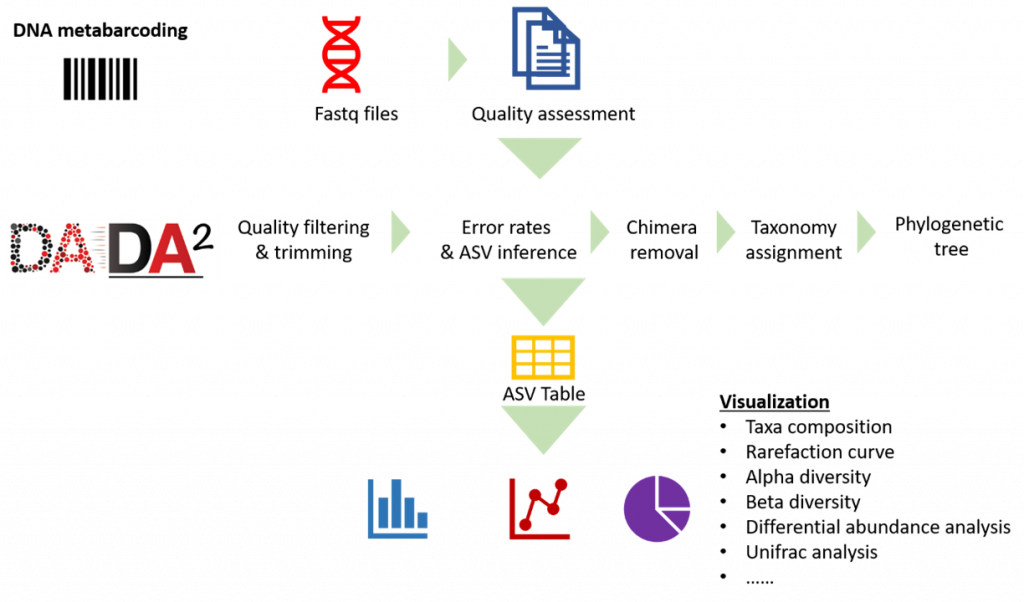
Analysis Pipeline
Our analysis pipeline uses Amplicon sequence variant (ASV) generation through the DADA2 workflow. Prior the analysis, quality assessment on the raw reads is done using fastqc. after which primers and adaptors are removed. Paired-end reads are processed and merged using DADA2. Chimera screening and taxonomy assignment is done using the SILVA nr database for bacteria 16s while UNITE ITS database used for Fungal ITS
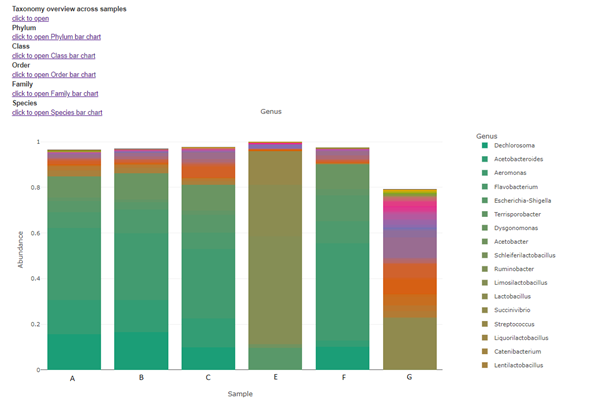
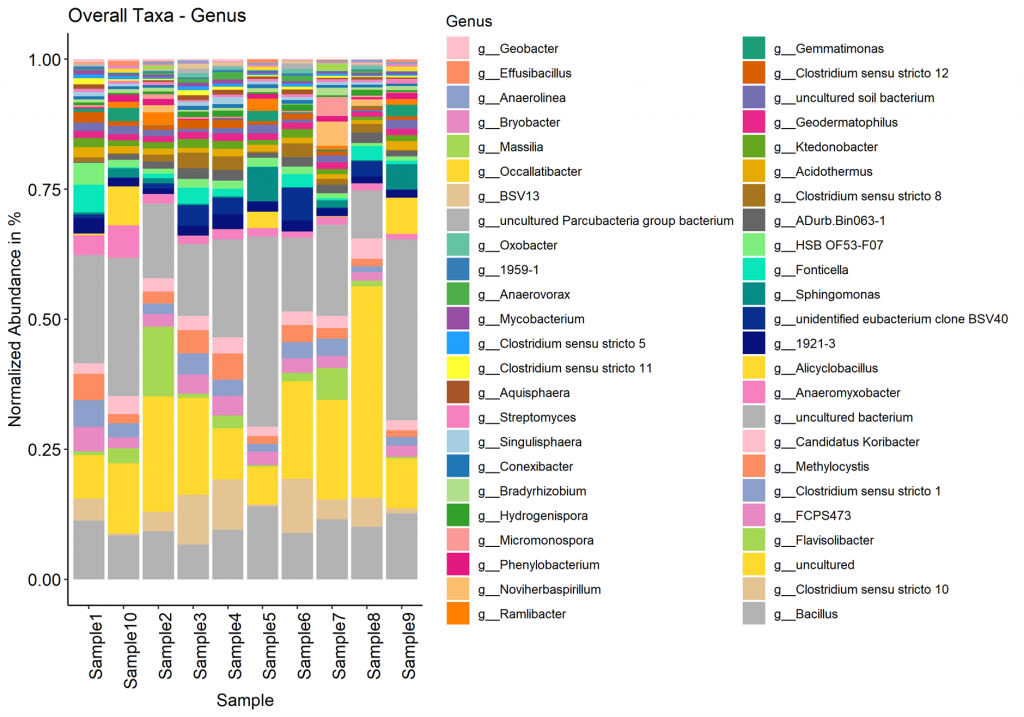
Taxa (Barplot)
Taxonomy information is shown as relative abundance at the family taxonomic level using an interactive bar plot. This interactive bar plot will help the customer in facilitating data exploration.
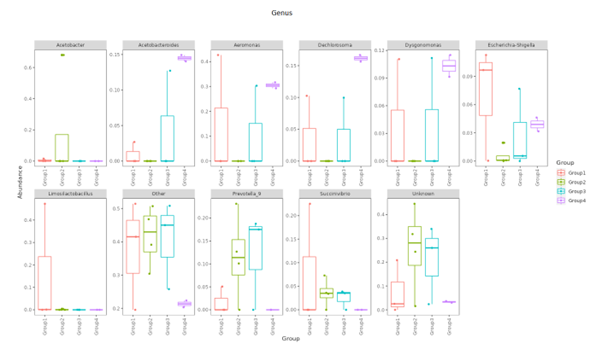
Top Ten taxa (Boxplot)
Top 10 species abundance layout at each taxonomic level and presented in boxplot format
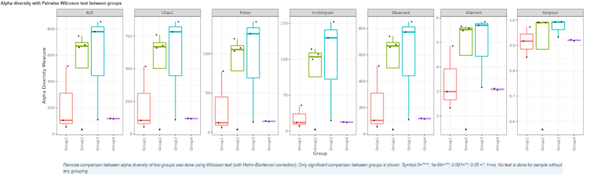
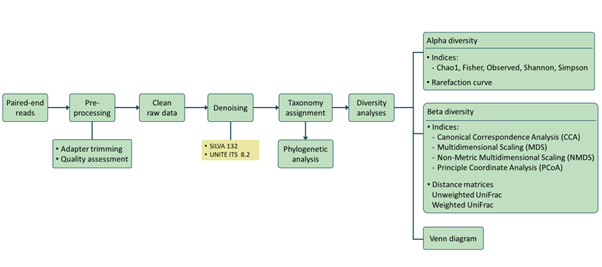
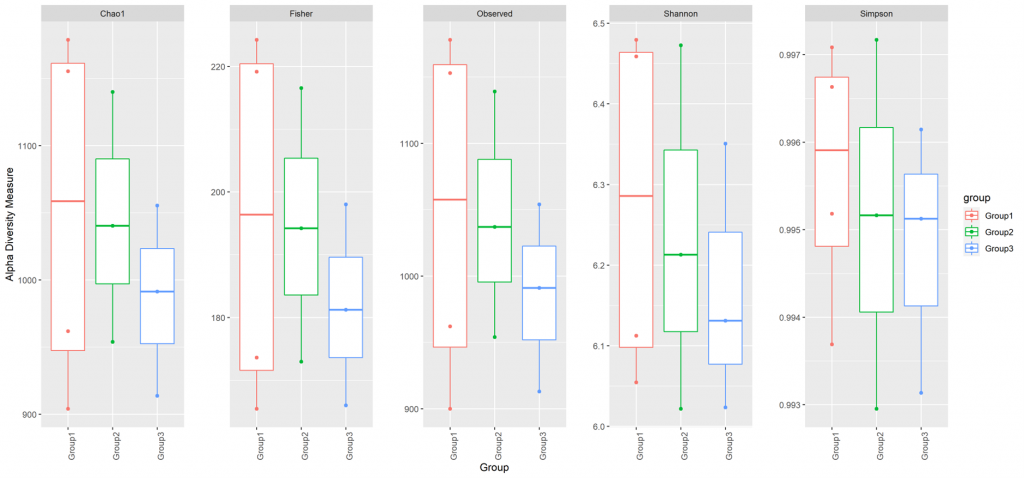
Alpha diversity
In ecology, alpha diversity is the mean species diversity in sites at a local scale. It reflects the richness and diversity of microbial community by using a series of statistical indices, species accumulation curve and species richness curve.
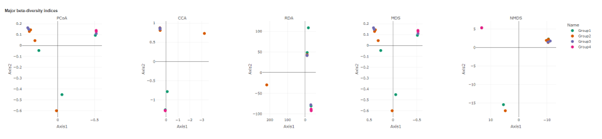
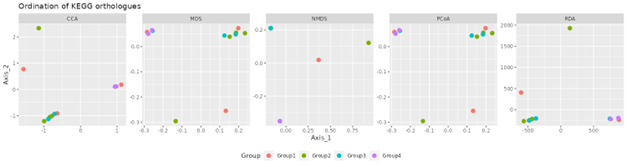
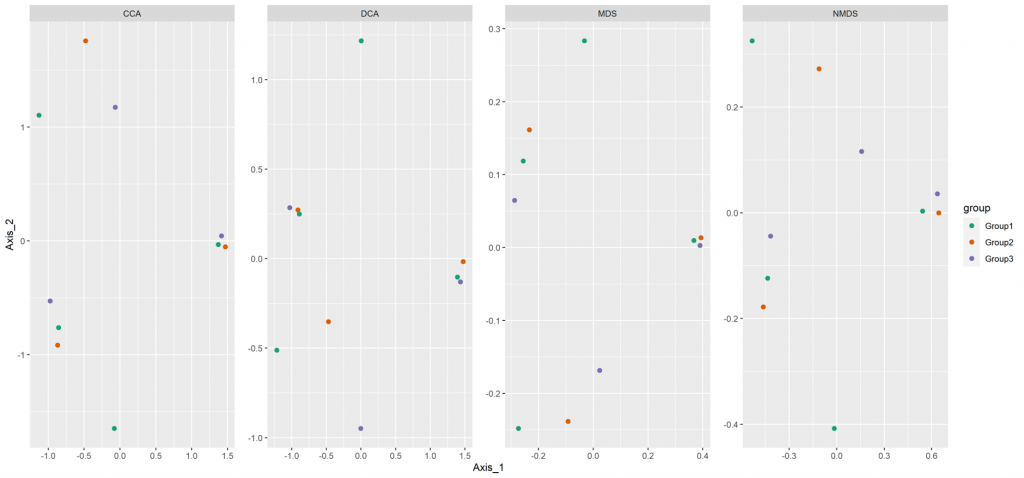
Beta diversity
Beta diversity compares compositional heterogeneity among microbial communities. Beta diversity metrics can be grouped in a couple of different ways. The results provided here are based on bray-Curtis dissimilarity matrix calculated at the ASV level.
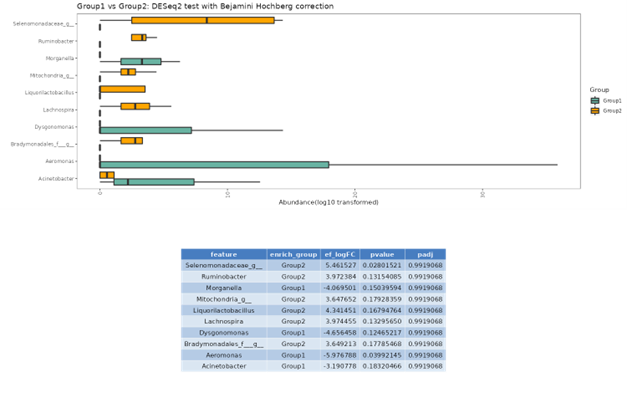
DESeq2
DESeq2 is a method for differential analysis of count data, using shrinkage estimation for dispersions and fold changes to improve stability and interpretability of estimates. This enables a more quantitative analysis focus on the strength rather than the mere presence of differential abundance.
Picrust2 analysis
Picrust2 predict2 metagenome functional content based on the microbiome composition.
Amplicon Sequencing Lite
(Metagenomics: 16s/18s and Fungus ITS)
Analysis pipeline
Our analysis pipeline uses Amplicon sequence variant (ASV) generation through the QIIME2 workflow. Prior the analysis, quality assessment on the raw reads is done using fastqc. after which primers and adaptors are removed. Paired-end reads are processed and merged using QIIME2. Chimera screening and taxonomy assignment is done using the SILVA nr database for bacteria 16s while UNITE ITS database used for Fungal ITS
Taxa (Barplot)
Taxonomy information is shown as relative abundance at the family taxonomic level present in bar plot
Alpha diversity
In ecology, alpha diversity is the mean species diversity in sites at a local scale. It reflects the richness and diversity of microbial community by using a series of statistical indices, species accumulation curve and species richness curve
Beta diversity
Beta diversity compares compositional heterogeneity among microbial communities. Beta diversity metrics can be grouped in a couple of different ways. The results provided here are based on bray-Curtis dissimilarity matrix calculated at the ASV level.
Publications Featuring Our Works
Check out the links below where our works have been featured in these publications:
- https://www.sciencedirect.com/science/article/pii/S235234092200364X
- https://www.data-in-brief.com/article/S2352-3409(19)31166-7/abstract
- https://www.sciencedirect.com/science/article/pii/S2352340922002608
- Full article: Functional profiling of bacterial communities in Lake Tuz using 16S rRNA gene sequences (tandfonline.com)
- The first dataset of de novo transcriptome assembly of Heterotrigona itama (Apidae, Meliponinae) queen larva - ScienceDirect
- Genome Sequence of a Virulent African Swine Fever Virus Isolated in 2020 from a Domestic Pig in Northern Vietnam | Microbiology Resource Announcements (asm.org)
- https://journals.asm.org/doi/abs/10.1128/mra.00446-19
- https://www.sciencedirect.com/science/article/pii/S036031992034739X
- https://sfamjournals.onlinelibrary.wiley.com/doi/abs/10.1111/1462-2920.15228
- https://www.mdpi.com/1278788
- https://www.mdpi.com/2309-608X/8/3/246
- https://annalsmicrobiology.biomedcentral.com/articles/10.1186/s13213-021-01625-9
- https://www.smujo.id/biodiv/article/view/3719
- https://www.sciencedirect.com/science/article/pii/S0304389420326777
- https://www.sciencedirect.com/science/article/pii/S0888754319308158